|
PhoenixHardware
0.2.0
Tools to get hardware information
|
|
PhoenixHardware
0.2.0
Tools to get hardware information
|
Performances of a function. More...
#include <PFunctionPerf.h>
Public Member Functions | |
| const std::string & | getName () const |
| Get the name of the function to profile. | |
| void | getPerf (size_t &nbCall, double &fullTime, double &averageTime, double &stdTime, size_t &minTime, size_t &maxTime) const |
| Get the performances of the current function. | |
| PFunctionPerf & | operator= (const PFunctionPerf &other) |
| Definition of equal operator of PFunctionPerf. | |
| PFunctionPerf (const PFunctionPerf &other) | |
| Copy constructor of PFunctionPerf. | |
| PFunctionPerf (const std::string &name="") | |
| Default constructor of PFunctionPerf. | |
| void | print (std::ostream &out=std::cout) const |
| Print the performance of the function. | |
| void | printCsv (std::ostream &out=std::cout) const |
| Print the performance of the function in CSV format. | |
| void | reset () |
| Reset the profiling. | |
| void | reset (size_t threadIndex) |
| Reset the profiling. | |
| void | resize (size_t nbThread) |
| Resize the PFunctionPerf by respect to the number of thread which call the function. | |
| void | setName (const std::string &name) |
| Set the name of the function profiled by the current PFunctionPerf. | |
| void | start (size_t threadIndex=0lu) |
| Start the timing for one function. | |
| void | stop (size_t threadIndex=0lu) |
| Stop the timing of one function. | |
| virtual | ~PFunctionPerf () |
| Destructor of PFunctionPerf. | |
Protected Member Functions | |
| void | copyPFunctionPerf (const PFunctionPerf &other) |
| Copy function of PFunctionPerf. | |
Private Member Functions | |
| void | initialisationPFunctionPerf (const std::string &name) |
| Initialisation function of the class PFunctionPerf. | |
Private Attributes | |
| std::vector< double > | p_fullSqrTime |
| Sum of all square times (used to compute standard deviation) | |
| std::vector< double > | p_fullTime |
| Full time of execution for the current function (compute the averaged time with nbCall) | |
| std::vector< size_t > | p_maxTime |
| Maximum execution time. | |
| std::vector< size_t > | p_minTime |
| Minimum execution time. | |
| std::string | p_name |
| Name of the function to profile. | |
| std::vector< size_t > | p_nbCall |
| Number of calls of the current function. | |
| std::vector< size_t > | p_timeBegin |
| Begin time of the current performance evaluation. | |
Performances of a function.
Definition at line 17 of file PFunctionPerf.h.
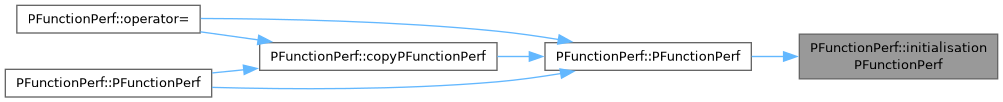
| PFunctionPerf::PFunctionPerf | ( | const std::string & | name = "" | ) |
Default constructor of PFunctionPerf.
| name | : name of the function to profile |
Definition at line 13 of file PFunctionPerf.cpp.
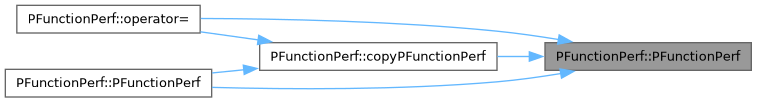
References initialisationPFunctionPerf().
Referenced by copyPFunctionPerf(), operator=(), and PFunctionPerf().
 Here is the call graph for this function: Here is the caller graph for this function:
| PFunctionPerf::PFunctionPerf | ( | const PFunctionPerf & | other | ) |
Copy constructor of PFunctionPerf.
| other | : class to copy |
Definition at line 20 of file PFunctionPerf.cpp.
References copyPFunctionPerf(), and PFunctionPerf().
Here is the call graph for this function:
|
virtual |
|
protected |
Copy function of PFunctionPerf.
| other | : class to copy |
Definition at line 167 of file PFunctionPerf.cpp.
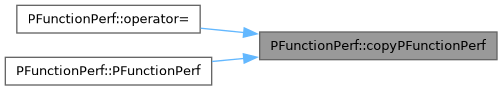
References p_fullSqrTime, p_fullTime, p_maxTime, p_minTime, p_name, p_nbCall, p_timeBegin, and PFunctionPerf().
Referenced by operator=(), and PFunctionPerf().
Here is the call graph for this function: Here is the caller graph for this function:| const std::string & PFunctionPerf::getName | ( | ) | const |
Get the name of the function to profile.
Definition at line 138 of file PFunctionPerf.cpp.
References p_name.
| void PFunctionPerf::getPerf | ( | size_t & | nbCall, |
| double & | fullTime, | ||
| double & | averageTime, | ||
| double & | stdTime, | ||
| size_t & | minTime, | ||
| size_t & | maxTime ) const |
Get the performances of the current function.
| [out] | nbCall | : number of time this function was called |
| [out] | fullTime | : total time of all function calls |
| [out] | averageTime | : average time of one function calls |
| [out] | stdTime | : standard deviation between all function calls (if nbCall is small this result can be unrelevant) |
| [out] | minTime | : minimum time of a single execution |
| [out] | maxTime | : maximum time of a single execution |
Definition at line 118 of file PFunctionPerf.cpp.
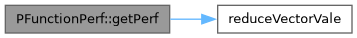
References p_fullSqrTime, p_fullTime, p_maxTime, p_minTime, p_nbCall, and reduceVectorVale().
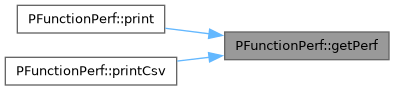
Referenced by print(), and printCsv().
Here is the call graph for this function: Here is the caller graph for this function:
|
private |
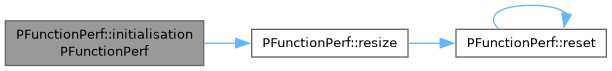
Initialisation function of the class PFunctionPerf.
| name | : name of the function to profile |
Definition at line 180 of file PFunctionPerf.cpp.
References p_name, and resize().
Referenced by PFunctionPerf().
Here is the call graph for this function: Here is the caller graph for this function:| PFunctionPerf & PFunctionPerf::operator= | ( | const PFunctionPerf & | other | ) |
Definition of equal operator of PFunctionPerf.
| other | : class to copy |
Definition at line 33 of file PFunctionPerf.cpp.
References copyPFunctionPerf(), and PFunctionPerf().
Here is the call graph for this function:| void PFunctionPerf::print | ( | std::ostream & | out = std::cout | ) | const |
Print the performance of the function.
| [out] | out : ostream to be used |
Definition at line 145 of file PFunctionPerf.cpp.
References getPerf(), and p_name.
Here is the call graph for this function:| void PFunctionPerf::printCsv | ( | std::ostream & | out = std::cout | ) | const |
Print the performance of the function in CSV format.
| [out] | out : ostream to be used |
Definition at line 156 of file PFunctionPerf.cpp.
References getPerf(), and p_name.
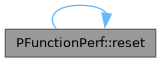
Here is the call graph for this function:| void PFunctionPerf::reset | ( | ) |
Reset the profiling.
Definition at line 91 of file PFunctionPerf.cpp.
References p_timeBegin, and reset().
Referenced by reset(), and resize().
Here is the call graph for this function: Here is the caller graph for this function:| void PFunctionPerf::reset | ( | size_t | threadIndex | ) |
Reset the profiling.
| threadIndex | : index of the current thread to be measured |
Definition at line 81 of file PFunctionPerf.cpp.
References p_fullSqrTime, p_fullTime, p_maxTime, p_minTime, p_nbCall, and p_timeBegin.
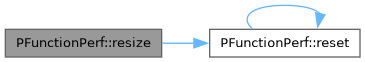
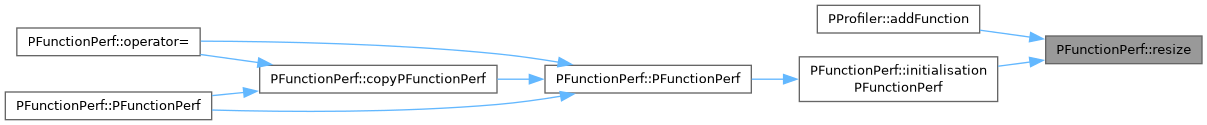
| void PFunctionPerf::resize | ( | size_t | nbThread | ) |
Resize the PFunctionPerf by respect to the number of thread which call the function.
| nbThread | : number of threads which call the function |
Definition at line 48 of file PFunctionPerf.cpp.
References p_fullSqrTime, p_fullTime, p_maxTime, p_minTime, p_nbCall, p_timeBegin, and reset().
Referenced by PProfiler::addFunction(), and initialisationPFunctionPerf().
Here is the call graph for this function: Here is the caller graph for this function:| void PFunctionPerf::setName | ( | const std::string & | name | ) |
Set the name of the function profiled by the current PFunctionPerf.
| name | : name of the function to profile |
Definition at line 41 of file PFunctionPerf.cpp.
References p_name.
| void PFunctionPerf::start | ( | size_t | threadIndex = 0lu | ) |
Start the timing for one function.
| threadIndex | : index of the current thread to be measured |
Definition at line 61 of file PFunctionPerf.cpp.
References p_timeBegin.
| void PFunctionPerf::stop | ( | size_t | threadIndex = 0lu | ) |
Stop the timing of one function.
| threadIndex | : index of the current thread to be measured |
Definition at line 68 of file PFunctionPerf.cpp.
References p_fullSqrTime, p_fullTime, p_maxTime, p_minTime, p_nbCall, and p_timeBegin.
|
private |
Sum of all square times (used to compute standard deviation)
Definition at line 53 of file PFunctionPerf.h.
Referenced by copyPFunctionPerf(), getPerf(), reset(), resize(), and stop().
|
private |
Full time of execution for the current function (compute the averaged time with nbCall)
Definition at line 51 of file PFunctionPerf.h.
Referenced by copyPFunctionPerf(), getPerf(), reset(), resize(), and stop().
|
private |
Maximum execution time.
Definition at line 57 of file PFunctionPerf.h.
Referenced by copyPFunctionPerf(), getPerf(), reset(), resize(), and stop().
|
private |
Minimum execution time.
Definition at line 55 of file PFunctionPerf.h.
Referenced by copyPFunctionPerf(), getPerf(), reset(), resize(), and stop().
|
private |
Name of the function to profile.
Definition at line 45 of file PFunctionPerf.h.
Referenced by copyPFunctionPerf(), getName(), initialisationPFunctionPerf(), print(), printCsv(), and setName().
|
private |
Number of calls of the current function.
Definition at line 49 of file PFunctionPerf.h.
Referenced by copyPFunctionPerf(), getPerf(), reset(), resize(), and stop().
|
private |
Begin time of the current performance evaluation.
Definition at line 47 of file PFunctionPerf.h.
Referenced by copyPFunctionPerf(), reset(), reset(), resize(), start(), and stop().